The 15 Most Polluted Cities In The UK For 2026
Pollution is a unique and ongoing menace to our planet. From plastic garbage patches stretching for thousands of miles in our oceans to poisonous fumes billowing out of factories and industrial facilities, the impacts of pollution are felt across the globe.
In recent decades, the UK has taken important steps to combat pollution and has seen some success, with figures gradually falling year-by-year in the run-up to net zero, and leafier suburbs offering cleaner, greener air. However, those statistics still have some ground to make up, as our report reveals.
With Tariff’s latest blog, we’ll explore which areas of the UK are the most polluted according to air pollution figures, as well as potential root causes for those rising figures.
Understanding Tariff’s Data On Pollution
In the interests of remaining transparent in how we report, our data was retrieved from IQAir’s historic data for the whole of 2025 (the most recent batch of data available), which measures air quality from over 80,000 live data points worldwide, and thousands across the length and breadth of the UK.
The data we use to determine air quality is the PM2.5 concentration (measured in µg/m³), which measures how much particulate matter is found in one cubic meter of air. These are one of the most concerning pollutants, in that they’re small enough to be absorbed into the bloodstream and can cause serious health problems if left unchecked for long periods of time.
Short-term effects include irritation of the throat and airways and persistent coughing, which are of major concern for those with asthma or respiratory issues. Longer-term impacts stem from the tiny particles’ invasive nature, which can lead to prolonged breathing issues, an irregular heartbeat, bronchitis, emphysema, and even early death.
These particles are an unavoidable part of modern life, however. They include:
- Car and motor vehicle emissions
- Processing and industrial plant facilities
- Power plants and fossil fuel energy projects
- Smoking and second-hand smoke
- Dust, soot and dirt
According to the World Health Organisation (WHO), anything below 5µg/m³ is considered within their guidelines, whilst anything above 5µg/m³ exceeds WHO guidelines. Figures above 10µg/m³ may pose health problems for sensitive or vulnerable groups (such as those with severe asthma or pre-existing respiratory issues), while measurements above 20µg/m³ are more universally unhealthy.
It’s essential, then, that pollutants are kept to a manageable and recognisably safe level, but that’s not always the case, as we’ll see with the most polluted areas in the UK.
The 15 Worst Cities For Pollution In The UK
We’ve used IQAir’s data to pinpoint the UK’s worst cities for air pollution, as well as the key points throughout the year that spark concern.
15. Cardiff
Average PM2.5 Concentration Of 9.1µg/m³
The Welsh capital, and a metropolitan beacon on the country’s southern coast, Cardiff’s place as one of the most polluted cities in the UK may come as a surprise, especially given the coastal influences and swathes of greenery across areas like Roath and Parc Tredelerch. But the statistics paint a different picture, with an average PM2.5 level of 9.1µg/m³
That’s a concerning return to the air pollution figures we saw in 2022 (10.7µg/m³), in spite of recent falls in the concentration of those harmful particles.
14. Worcester
Average PM2.5 Concentration Of 9.2µg/m³
Famed for its cathedral that harks back to the 680AD, Worcester’s well-preserved exterior is a testament to the UK’s desire to maintain our heritage. The same can’t be said of the city’s air quality, however, which hovered at an average of 9.2µg/m³ across 2025 – just under twice the levels recommended by the WHO.
It’s not all negatives, however. September of last year saw a triumphant return to cleaner air for the city, with that being the only month that conformed with the WHO’s safe levels of PM2.5.
13. Rotherham
Average PM2.5 Concentration Of 9.3µg/m³
A historic and culturally-significant part of South Yorkshire, Rotherham’s place among the UK’s worst areas for air pollution is concerning, particularly given its spot on green belt land and at the confluence of two rivers. But with an average PM2.5 concentration of 9.3µg/m³ for the whole of 2025, there’s little debating the town’s issues.
There are positive developments, however – this statistic places it around 8% lower than the levels we saw in 2024.
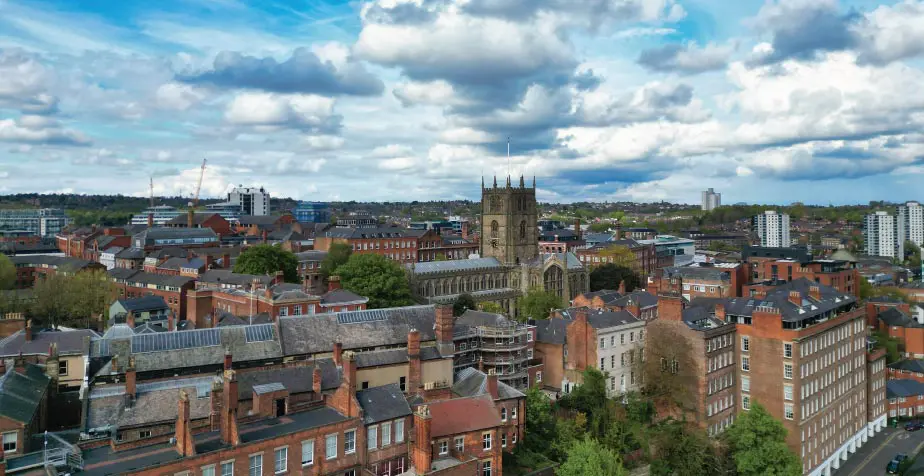
12. Nottingham
Average PM2.5 Concentration Of 9.3µg/m³
A city of infamy thanks to the legendary tales of Robin Hood, Nottingham’s real-world presence is equally impactful, playing host to literary greats, impressive architecture, and a deceptively large economy. The city’s reputation for air pollution, however, sees it earn a spot among the UK’s most polluted, with an overall PM2.5 concentration of 9.3µg/m³ in 2025.
It’s an odd blend that sees that become the city’s average, however. The early part of 2025 (January – April) saw an average PM2.5 figure of 13.5µg/m³, while September dipped into the WHO’s recommended levels at 4.8µg/m³.
11. Luton
Average PM2.5 Concentration Of 9.3µg/m³
While it’s perhaps most known for its airport, Luton’s got far more than meets the eye to keep the crowds, with the town hosting Europe’s largest single-day carnival every May. But while that’s a major draw, the town’s ongoing issues with air pollution provide a counterargument, with the PM2.5 concentration close to double the WHO’s recommended levels at 9.3µg/m³.
February and March of 2025 were the biggest spikes in that level, with an average of 16.5µg/m³ across both months – more than 3 times the WHO’s suggested guidelines.
10. Winchester

Average PM2.5 Concentration Of 9.4µg/m³
A Hampshire mainstay, Winchester combines a keen sense of local culture (best seen through its annual Hat Fair) with arguably one of the UK’s most well-respected historical archives in places like the Guildhall, Castle and Great Minster Street. The city also contends with one of the country’s higher rates of PM2.5 air pollution – 9.4µg/m³.
But while that rate does place it among the ten worst areas for air pollution in the UK, there’s a positive note to be found in the fact that the city has seen a considerable decrease since 2022’s PM2.5 figure of 12.8µg/m³.
9. Doncaster
Average PM2.5 Concentration Of 9.4µg/m³
Renowned for a storied history with railway travel, Doncaster is one of the UK’s youngest cities, with it earning the title in late 2022 as part of the Platinum Jubilee Honours. But while it’s just beginning its journey as a city, the track record for its air pollution is well-established, with Doncaster seeing an average PM2.5 concentration of 9.4µg/m³ in 2025.
The year was very much a tale of two halves, with February seeing an unprecedented 18.8µg/m³, but 2025 overall was almost 20% lower than 2024’s figures.
8. Bournemouth
Average PM2.5 Concentration Of 9.6µg/m³
One of the principal seaside resorts on the southern coast, Bournemouth is also one of the area’s most popular. The town’s draws range from Premier League football clubs to sandy beaches and a thriving nightlife, although these benefits are perhaps offset by the troubling level of air quality found in Bournemouth, with an average of 9.6µg/m³ being recorded over 2025.
What’s perhaps more worrying is that this is a climb compared with the figures of last year, and is perhaps representative of a larger root issue.
7. Manchester
Average PM2.5 Concentration Of 9.7µg/m³
A self-proclaimed capital of the North, Manchester’s cultural, industrial and commercial contributions can’t be understated. While that’s more than enough to attract the discerning traveller to this Northern powerhouse, the city’s pollution statistics are a different story, with Manchester’s PM2.5 levels at a concerning 9.7µg/m³.
That’s worryingly consistent, and March 2025 exemplifies that level of concern, with levels reaching 15.2µg/m³ for that month – more than triple the WHO’s guidelines for clean air.
6. Liverpool
Average PM2.5 Concentration Of 9.8µg/m³
One of the UK’s most culturally significant cities, and renowned for its nightlife and legendary hospitality, Liverpool rarely needs an introduction. However, the city’s equally impactful industrial enterprises along the Docks and Wavertree Technology Park offer a pollution-tinged undertone, with Liverpool’s PM2.5 levels for 2025 reaching 9.8µg/m³.
That’s enough to see Liverpool rank just behind the capital for its air pollution figures, with February seeing levels reach more than 3 times the WHO’s recommended figures (17µg/m³).
5. London
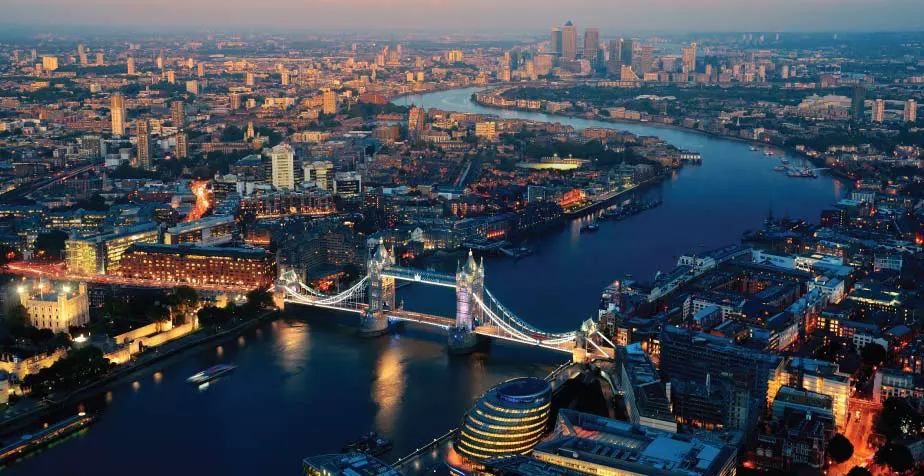
Average PM2.5 Concentration Of 9.9µg/m³
A worldwide powerhouse of business and commerce, there’s not much to be said about the UK’s capital that’s not already been reiterated time and time again. But while it’s a major metropolis in its own right and a seamless blend of cultures and influences, London’s pollution figures are a much-maligned area of concern.
In 2025, the capital saw its PM2.5 concentration take it into the 5 worst areas of the UK for air pollution, with a yearly average of 9.9µg/m³.
4. Brighton & Hove
Average PM2.5 Concentration Of 10µg/m³
One of England’s most iconic seaside resorts, characterised by that monumental pier that stretches into the Channel, Brighton and its accompanying Hove area are a hub for travellers to the country’s south coast. Despite that coastal charm, though, Brighton’s air pollution rate is more than double the WHO’s guidelines.
Over the course of the last year, that averaged out to a PM2.5 concentration of 10µg/m³, with December’s figure rounding out the year with a startling 14.2µg/m³.
3. St Albans
Average PM2.5 Concentration Of 10.4µg/m³
Often viewed as an extension of neighbouring Watford, St Albans is far more than that. A city in its own right, the ancient Cathedral is the biggest attraction, characterising an area that’s firmly grounded in its history. It’s also unfortunately building a secondary reputation as one of England’s worst cities for air pollution, with 2025 seeing an average PM2.5 rate of 10.4µg/m³.
More than half the year saw PM2.5 figures in excess of double the WHO’s recommended levels, with March seeing more than triple the suggested levels (at 15.3µg/m³).
2. Ipswich
Average PM2.5 Concentration Of 10.4µg/m³
Suffolk’s largest urban area and county town, Ipswich, blends a distinct agricultural backdrop (largely down to the surrounding Suffolk countryside) against a more cosmopolitan feel in its modernised waterfront. But while natural surroundings paint an idyllic picture, it’s offset by Ipswich’s top 5 place among the UK’s most polluted areas.
The average PM2.5 concentration of 10.4 µg/m³ is concerning, at more than twice the WHO-recommended limit, but February and March of last year exceeded that amount by almost 5 times.
1. Northampton
Average PM2.5 Concentration Of 10.7µg/m³
Officially the UK’s worst area for air pollution, Northampton’s PM2.5 concentration of 10.7µg/m³ is cause enough for concern. With its closeness to the M1 and major industrial premises at Brackmills, it may not come as a surprise, but it’s also proven to be a recurring issue for the town, with every year between 2017 and 2022 reaching a similarly high level of PM2.5 concentration.
Plus, with the early part of 2025 seeing an average PM2.5 level of 14.7µg/m³, the town’s position as the UK’s worst for air pollution shows no signs of changing any time soon.
What’s Being Done To Combat Air Pollution?
While these statistics on the UK’s worst areas for air pollution make for concerning reading, they’re not an isolated issue. Cities and towns across the world are at increased risk as we continue to burn through fossil fuels at an unprecedented rate, and Asian countries like China, India and Pakistan are consistently seeing PM2.5 rates of well above 100µg/m³.
It’s a worrying trend, but there are positives on the horizon, many of which are spearheaded by the United Nations’ Climate & Clean Air Coalition (CCAC). A voluntary initiative that’s already been joined by around 200 governments and climate-focused organisations, the CCAC seeks to protect the climate and improve global air quality by targeted initiatives designed to reduce short-lived atmospheric pollutants like PM2.5, methane, black carbon, and HFCs (hydrofluorocarbons).
The launch of the CCAC’s Super Pollutant Country Action Accelerator is concrete proof of that, seeking to deliver “tailored technical assistance projects” for a group of member nations with the ultimate goal of lowering PM2.5 and other pollutant levels across those areas. It’s arguably the first of its kind, and the $150 million backing ensures that it’s got the finances needed to move the needle on a project of this scale.
Outside of that, it’s all about small-scale changes we can make to ensure that we’re able to minimise our own PM2.5 emissions. Opting for public transport over a personal car is a low-effort, high-impact way to minimise emissions, alongside limiting the amount of wood you burn, running BBQs outdoors, and controlling humidity in your home.
Certain products, like home air quality monitors and HVAC air filters for businesses, allow for a more proactive way to control local levels of PM2.5, and ultimately wrest back control of the emissions that can affect us. For larger-scale changes aimed towards businesses and bigger emitters, energy switching services are often the way forward.
With Tariff, we’re your partner in delivering a clearer path to cleaner energy and to a brighter future for some of the UK’s hardest hit when it comes to air pollution. Get in touch today to discuss how we can help and how we’re paving the way for an environmentally-friendly future for all.
Recent Blogs


Are you ready to save the planet and money?
Save Up To 40% Off Your Utility Bills
National Coverage

Energy Consultant
Energy Consultant
Sophie is an Energy Expert specialising in energy efficiency, renewable energy, and practical energy advice. She writes clear, research-led content that helps consumers understand energy tariffs, reduce energy costs, and make informed decisions about their energy use.